Hope Research · 2027 Edition
7 Workforce Trends That Will Shape 2027
What people leaders need to know about managers, retention and change, and what to do this quarter.
A 12-minute read · Last updated October 13, 2026
Introduction
The signal gap
Leaders are being asked for more growth and productivity in 2027, with fewer management layers and less room for error. Yet most organizations still measure how their people are doing once a year, while pressure builds week to week.
That gap between when pressure builds and when leaders see it is where good people leave, managers burn out and change programs stall. The seven trends in this report come from the most recent research by Gallup, Gartner and others. Each one ends with something practical to do this quarter.
Three of the trends include a live poll. Vote and see instantly how your view compares with other people leaders.
Key takeaways
- 01Doing more with fewer layers. Productivity expectations are rising while management layers shrink, making the workforce more “load-bearing.”
- 02Manager burnout is driving the engagement crisis. Manager engagement fell from 31% to 22% in three years, and managers shape most of how engaged their teams are.
- 03AI adoption runs through managers, not tools. Employees with supportive managers are far more likely to say AI has transformed their work.
- 04Preventable turnover becomes a leadership metric. 42% of people who quit say their manager or organization could have kept them.
- 05Change fatigue is the new capacity limit. Fewer than half of employees achieve the change goals set for them.
- 06Listening shifts from annual surveys to weekly signals. Most employees don't believe their feedback leads to action, and engagement suffers when it doesn't.
- 07Closing the frontline “two cultures” gap. Three in four frontline employees report burnout, and nearly half see a separate culture for them.
Trend 1 · Productivity
Doing more with less: productivity expectations rise as management layers shrink
What's happening
CEOs want growth and productivity in 2027, and many are redesigning their operating models to get it. Gartner reports that 63% of CEOs and senior executives are radically redesigning the operating model to accelerate financial returns from AI. At the same time, organizations are removing management layers and slowing junior hiring.
The result is what Gartner calls a “load-bearing” workforce: fewer people, carrying more weight, with less slack when something goes wrong.
Why it matters
When fewer people carry more of the load, small signs of strain matter more. A struggling team or an overloaded manager is harder to cover for, and the cost of missing it shows up faster in delivery, absence and exits.
67%
of CHROs report increased expectations for employee productivity, while their organizations cut middle-management layers and hire fewer entry-level employees.
Source: Gartner survey of 297 CHROs, July 2026
47%
of managers say they are working harder than they were a year ago.
Source: Gartner HR survey, April 2026
Do this quarter
- 1Identify the teams carrying the most critical work after any restructure.
- 2Ask how you would know, within weeks, if one of them was nearing its limit.
- 3Agree one leading indicator of team capacity your leadership team will review monthly.
Which is highest on your list for 2027?
Sources: Gartner, “CHROs' Top Priorities for 2027,” press release, October 6, 2026 (July 2026 survey of 297 CHROs; May 2026 survey of 203 CEOs and senior executives). Gartner HR survey on managers, press release, April 29, 2026.
Share this trend
Trend 2 · Managers
Manager burnout is driving the engagement crisis
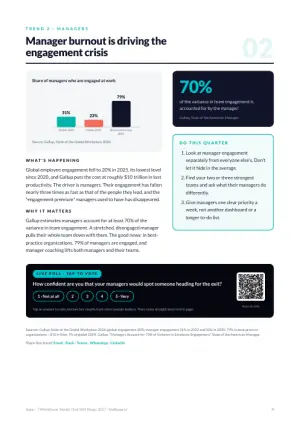
Column chart, Share of managers who are engaged at work: Global, 2022 31%; Global, 2025 22%; Best-practice orgs, 2025 79%.
Source: Gallup, State of the Global Workplace 2026.
What's happening
Global employee engagement fell to 20% in 2025, its lowest level since 2020, and Gallup puts the cost at roughly $10 trillion in lost productivity. The driver is managers. Their engagement has fallen nearly three times as fast as that of the people they lead, and the “engagement premium” managers used to have has disappeared.
Why it matters
Gallup estimates managers account for at least 70% of the variance in team engagement. A stretched, disengaged manager pulls their whole team down with them. The good news: in best-practice organizations, 79% of managers are engaged, and manager coaching lifts both managers and their teams.
70%
of the variance in team engagement is accounted for by the manager.
Source: Gallup, State of the American Manager
Do this quarter
- 1Look at manager engagement separately from everyone else's. Don't let it hide in the average.
- 2Find your two or three strongest teams and ask what their managers do differently.
- 3Give managers one clear priority a week, not another dashboard or a longer to-do list.
How confident are you that your managers would spot someone heading for the exit?
Sources: Gallup, State of the Global Workplace 2026 (global engagement 20%; manager engagement 31% in 2022 and 22% in 2025; 79% in best-practice organizations; ~$10 trillion, 9% of global GDP). Gallup, “Managers Account for 70% of Variance in Employee Engagement,” State of the American Manager.
Share this trend
Trend 3 · AI and managers
AI adoption runs through managers, not tools
Bar chart, Leadership readiness for AI: Leaders prepared to drive AI goals 36%; Needs evolving faster than programs 60%.
Share of HR leaders who agree.
What's happening
Most organizations have invested in AI tools. Far fewer have seen them change how work gets done. Gallup found that the strongest predictor of AI adoption isn't the technology itself. It's whether an employee's manager actively supports using it.
That puts more weight on a group that is already stretched. Gartner reports that 60% of HR leaders agree leadership needs are evolving faster than development programs can keep up.
Why it matters
Rebuilding manager engagement and getting value from AI are the same project, not two separate ones. If managers are overloaded, AI programs stall at the team level, however good the tools are.
8.7×
Employees whose managers actively support AI use are 8.7 times more likely to say AI has transformed their work.
Source: Gallup, State of the Global Workplace 2026
36%
of HR leaders say most of their leaders are prepared to drive their organization's AI objectives.
Source: Gartner HR Symposium, October 2026
Do this quarter
- 1Add a manager-capacity check to every AI rollout plan.
- 2Ask which teams have managers with the time and confidence to lead the change.
- 3Start AI adoption with your strongest managers, then spread what works.
Sources: Gallup, State of the Global Workplace 2026, as summarized by Brian Heger, Talent Edge Weekly. Gartner, “HR Symposium/Xpo London: Day 1 Highlights,” October 6, 2026.
Share this trend
Trend 4 · Retention
Preventable turnover becomes a leadership metric
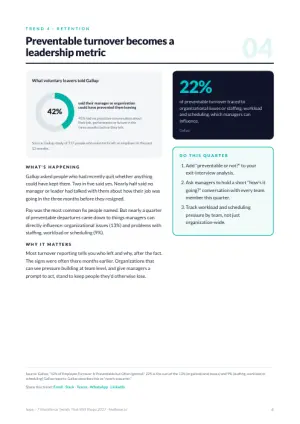
Donut chart: 42% said their manager or organization could have prevented them leaving. 45% had no proactive conversation about their job, performance or future in the three months before they left.
said their manager or organization could have prevented them leaving
45% had no proactive conversation about their job, performance or future in the three months before they left.
Source: Gallup study of 717 people who voluntarily left an employer in the past 12 months.
What's happening
Gallup asked people who had recently quit whether anything could have kept them. Two in five said yes. Nearly half said no manager or leader had talked with them about how their job was going in the three months before they resigned.
Pay was the most common fix people named. But nearly a quarter of preventable departures came down to things managers can directly influence: organizational issues (13%) and problems with staffing, workload or scheduling (9%).
Why it matters
Most turnover reporting tells you who left and why, after the fact. The signs were often there months earlier. Organizations that can see pressure building at team level, and give managers a prompt to act, stand to keep people they'd otherwise lose.
What could preventable turnover be costing you?
Gallup estimates replacing an employee costs one-half to two times their annual salary.
Leavers per year
100
Preventable (42%)
42
Estimated cost of preventable turnover
$1,155,000
500 people × 20% turnover × 42% preventable × $55,000 salary × 0.5× replacement cost.
Illustrative estimate based on your inputs and Gallup's published figures. Not a forecast.
22%
of preventable turnover traced to organizational issues or staffing, workload and scheduling, which managers can influence.
Source: Gallup
Do this quarter
- 1Add “preventable or not?” to your exit-interview analysis.
- 2Ask managers to hold a short “how's it going?” conversation with every team member this quarter.
- 3Track workload and scheduling pressure by team, not just organization-wide.
Source: Gallup, “42% of Employee Turnover Is Preventable but Often Ignored.” 22% is the sum of the 13% (organizational issues) and 9% (staffing, workload or scheduling) Gallup reports; Gallup describes this as “nearly a quarter.”
Share this trend
Trend 5 · Change
Change fatigue is the new capacity limit
Bar chart, How business leaders describe their teams: Change is a significant source of stress 39%; Teams wait to see if changes stick 36%.
Gartner, April 2025, ~1,000 business leaders.
What's happening
Organizations are running more change at once: restructures, new operating models, AI rollouts and policy changes, often overlapping. Gartner found that fewer than half of employees achieve the change goals set for them.
In a survey of nearly 1,000 business leaders, 36% said their teams tend to hesitate and wait to see whether changes will stick before adopting them. And 39% said change is a significant source of stress for their teams.
Why it matters
Most change programs measure progress with milestones and an annual survey. That tells you whether the plan was delivered, not whether people can absorb what comes next. The question for 2027 is how much more change your teams can take, and where that capacity is thinning.
45%
of employees say they realized the change goals set by their organization.
Source: Gartner, October 2025
up to 42%
drop in employees' intent to stay linked to change fatigue, with performance down by as much as 27%.
Source: Gartner research
Do this quarter
- 1List every change landing on each team in the next six months, side by side.
- 2Sequence the next wave away from the teams already carrying the most.
- 3Read team signals before and after each milestone, not just at year-end.
Sources: Gartner, “Less Than Half of Employees Achieved the Change Goals Set by Their Organization,” press release, October 9, 2025 (April 2025 survey of nearly 1,000 mid- to senior-level business leaders). Intent-to-stay and performance figures from earlier Gartner research on change fatigue (HR Leaders Survey, 2023).
Share this trend
Trend 6 · Listening
Employee listening shifts from annual surveys to weekly signals
Bar chart, Engagement depends on whether people believe feedback leads to action: Believe action will follow a survey 86% engaged; Don't believe action will follow 47% engaged.
Average engagement rate by group · Inpulse analysis of 40,000 responses.
What's happening
More than half of employees (54%) don't believe their organization will act on engagement survey results. Those who don't believe action will follow are far less engaged. Gallup found that just 8% of employees strongly agree their organization acts on survey results.
Why it matters
An annual survey reports back after the moment has passed, and often after the people who were struggling have gone. The organizations pulling ahead listen in shorter, more frequent bursts, act at team level, and show people what changed as a result. Participation follows visible action.
8%
of employees strongly agree their organization acts on survey results.
Source: Gallup, 2023
Do this quarter
- 1For your last survey, list what changed as a result, and tell people.
- 2Pick one team-level signal to check monthly, not annually.
- 3Close every loop with a simple “you said, we did.”
How often do you get a real read on how your teams are doing?
Sources: Inpulse analysis of 40,000 engagement responses, reported in The HR Director. Gallup (2023), cited in HR Grapevine, August 2026. Inpulse is an engagement vendor; figures are its own analysis.
Share this trend
Trend 7 · Frontline
Frontline employee engagement: closing the “two cultures” gap
76%
of frontline employees reported burnout in 2025.
Source: UKG, 8,200 frontline employees, 10 countries
47%
say their organization has two separate cultures: one for frontline employees and one for everyone else.
Source: UKG, 2026 frontline study
58%
of hospitality frontline employees say their schedules make a healthy lifestyle impossible.
Source: UKG
What's happening
Frontline and deskless workers make up the large majority of the global workforce, yet most workplace tools, surveys and programs are designed for people at desks. Frontline employees rarely have a company laptop or email, so they are the hardest to hear from and the easiest to miss.
Pay and scheduling flexibility top the reasons frontline employees give for leaving. Their managers are often promoted from the floor, with little time and little data to work with.
Why it matters
In retail, hospitality, healthcare and logistics, the frontline is where revenue and service are delivered. If leaders can't see how frontline teams are doing until people quit, they're always reacting. Reaching people on the phone they already carry, and giving their managers simple prompts, closes the gap.
Do this quarter
- 1Check what share of your frontline actually responded to your last survey.
- 2Offer a way to give feedback that doesn't need a laptop or login, such as text.
- 3Give frontline managers a two-minute pre-shift prompt, not a report.
Source: UKG, “Global Study Reveals Flexibility and Financial Wellness Are Top 2026 Priorities for Frontline Workers,” January 2026, based on a 2025 study of 8,200 frontline employees in 10 countries commissioned by UKG and Workplace Intelligence. UKG is a workforce software vendor.
Share this trend
Take action
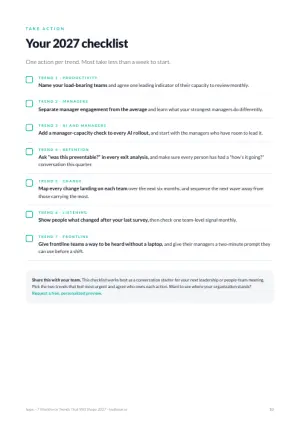
Your 2027 checklist
One action per trend. Most take less than a week to start.
0 of 7 started
Share with your team
Get a free, personalized preview of what Hope would show for your organization
Limited places each month. For organizations with 200+ employees.
Request your previewAbout Hope
How Hope helps leaders close the signal gap
Hope is a workforce performance intelligence platform. It gives leaders a continuous read on the people drivers of revenue, retention and risk, and gives managers clear actions to improve them.
1 · Measure
The Hope Index™ sets a private baseline across five workforce conditions: Purpose, Health, Environment, Relationships and Security.
2 · Listen
Short recurring check-ins, including by text or WhatsApp for frontline teams, track what's moving.
3 · Act
Elpis, Hope's AI, gives leaders their priorities and each manager one clear action, with the words to use.
4 · Improve
Hope measures whether conditions actually improve, and what to do next.
Get a free, personalized preview of what Hope would show for your organization
We'll build a private walkthrough for your organization, using public information only, and take you through it in 20 minutes:
- The three workforce priorities most likely to matter to you in 2027
- What your leaders, managers and teams would each see
- What a 90-day Hope Activate program would measure
Limited places each month. For organizations with 200+ employees.
Request your previewFAQs
Frequently asked questions
Sources and methodology
Sources
- Trend 1 · Productivity
- Gartner, “CHROs' Top Priorities for 2027,” press release, October 6, 2026 (July 2026 survey of 297 CHROs; May 2026 survey of 203 CEOs and senior executives). Gartner HR survey on managers, press release, April 29, 2026.
- Trend 2 · Managers
- Gallup, State of the Global Workplace 2026 (global engagement 20%; manager engagement 31% in 2022 and 22% in 2025; 79% in best-practice organizations; ~$10 trillion, 9% of global GDP). Gallup, “Managers Account for 70% of Variance in Employee Engagement,” State of the American Manager.
- Trend 3 · AI and managers
- Gallup, State of the Global Workplace 2026, as summarized by Brian Heger, Talent Edge Weekly. Gartner, “HR Symposium/Xpo London: Day 1 Highlights,” October 6, 2026.
- Trend 4 · Retention
- Gallup, “42% of Employee Turnover Is Preventable but Often Ignored.” 22% is the sum of the 13% (organizational issues) and 9% (staffing, workload or scheduling) Gallup reports; Gallup describes this as “nearly a quarter.”
- Trend 5 · Change
- Gartner, “Less Than Half of Employees Achieved the Change Goals Set by Their Organization,” press release, October 9, 2025 (April 2025 survey of nearly 1,000 mid- to senior-level business leaders). Intent-to-stay and performance figures from earlier Gartner research on change fatigue (HR Leaders Survey, 2023).
- Trend 6 · Listening
- Inpulse analysis of 40,000 engagement responses, reported in The HR Director. Gallup (2023), cited in HR Grapevine, August 2026. Inpulse is an engagement vendor; figures are its own analysis.
- Trend 7 · Frontline
- UKG, “Global Study Reveals Flexibility and Financial Wellness Are Top 2026 Priorities for Frontline Workers,” January 2026, based on a 2025 study of 8,200 frontline employees in 10 countries commissioned by UKG and Workplace Intelligence. UKG is a workforce software vendor.
Methodology. This report draws on published research from independent research firms and, where noted, vendor studies. Figures are reported as published, with their source and date. Live poll results reflect the people leaders who have chosen to answer and are not a representative sample. Hope Platform Ltd does not endorse the products of any vendor cited.
Last updated: October 13, 2026